
Eliminating usability errors to Inspire Action
High Stakes
Giffords Law Center’s Annual Gun Law Scorecard analyzes how each state’s gun safety laws correlate with gun violence. Their attorneys track legislation, assign point values, and compare results with CDC data—revealing a consistent truth: stronger gun laws save lives. In late 2021, Giffords partnered with nclud to redesign the scorecard ahead of the January 2022 release.
As the Lead UX Designer, I was responsible for decisions related to information architecture, interaction design, and content strategy.
What are we trying to achieve with this redesign?
Make it personal
It’s a national report. But the real impact happens locally. How do we spotlight each user’s state and inspire action?
good usability
The Scorecard was already interactive, but sometimes users missed the interaction entirely or didn’t know what was interactive in the first place.
One ia
The Scorecard page didn’t share the site’s navigation or footer. No big deal, except users didn’t have an easy way to come in or get out.
mobile optimization
The map experience broke down on mobile—tiny states, impossible touch targets. Even with a bandaid solution, we had to do more to optimize.
Storytelling
Outside of the data, there are important events that the Scorecard aimed to highlight. The page needed to have a balanced mix of data and storytelling.
navigating one long page
The Giffords team was concerned about the length of the page, but they insisted on a one-page experience for the Scorecard.
New UX Loading
〰️
New UX Loading 〰️
Access the Scorecard from anywhere
With ample opportunities to open the scorecard, users were never far from the core message: what do gun safety laws look like in your own state?
And the cherry on the cake? This new modal design worked interchangeably from mobile to desktop.
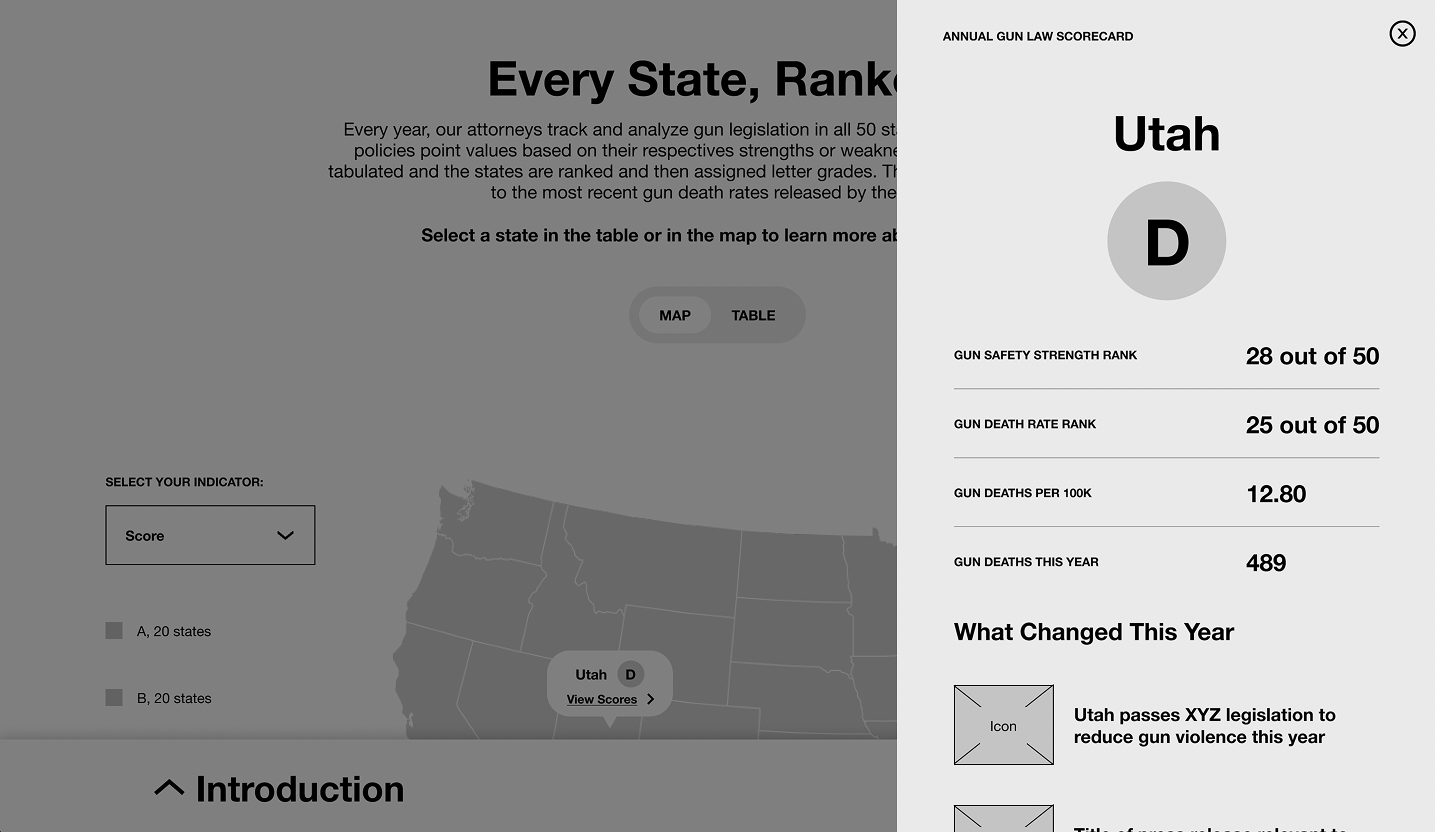
The scorecard opens in a modal window on the right side of the screen.
Toggle between the map and the table
Choose your own adventure. For this to work, I also added an indicator dropdown and a legend to the map. The legend was so important because the color ranges changed across indicators.
For gun law safety rank, low numbers = good.
For gun death rate rank, low numbers = bad.

Persistent toggle allows user to customize view.
ADAPT THE MOBILE EXPERIENCE
To bring the table into the mobile experience, we repurposed the toggle as a button beneath the dropdown. The horizontal, scroll-enabled table was still interactive, but the default view was limited to 10 states with a button to “Show More.”

This was the first time I had to design for a table on mobile.
play the Comparison game
To personalize gun violence in one’s own state, I suggested a table to compare against other states or the national average.
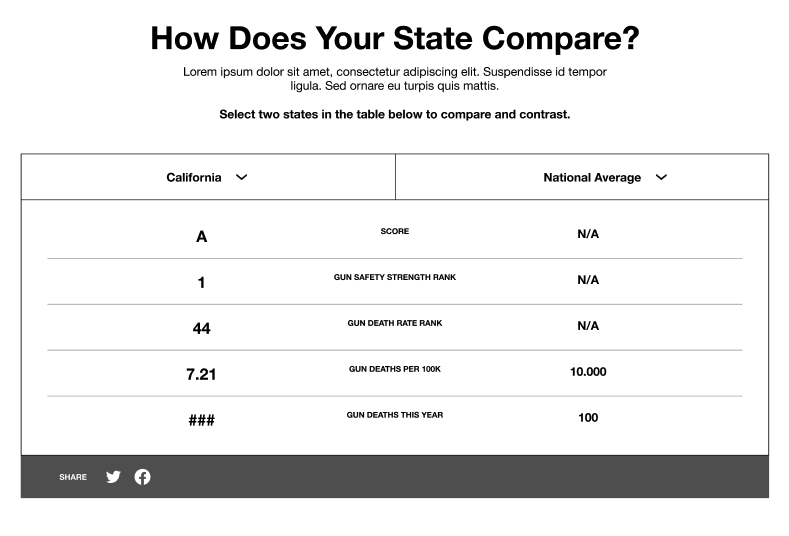
Easily compare two states with dropdowns on either side of the table.
Navigate THE PAGE with a bottom navigation
The new Scorecard page was just as long as the original. But now, users can jump between every section on the page with an omnipresent bottom navigation.
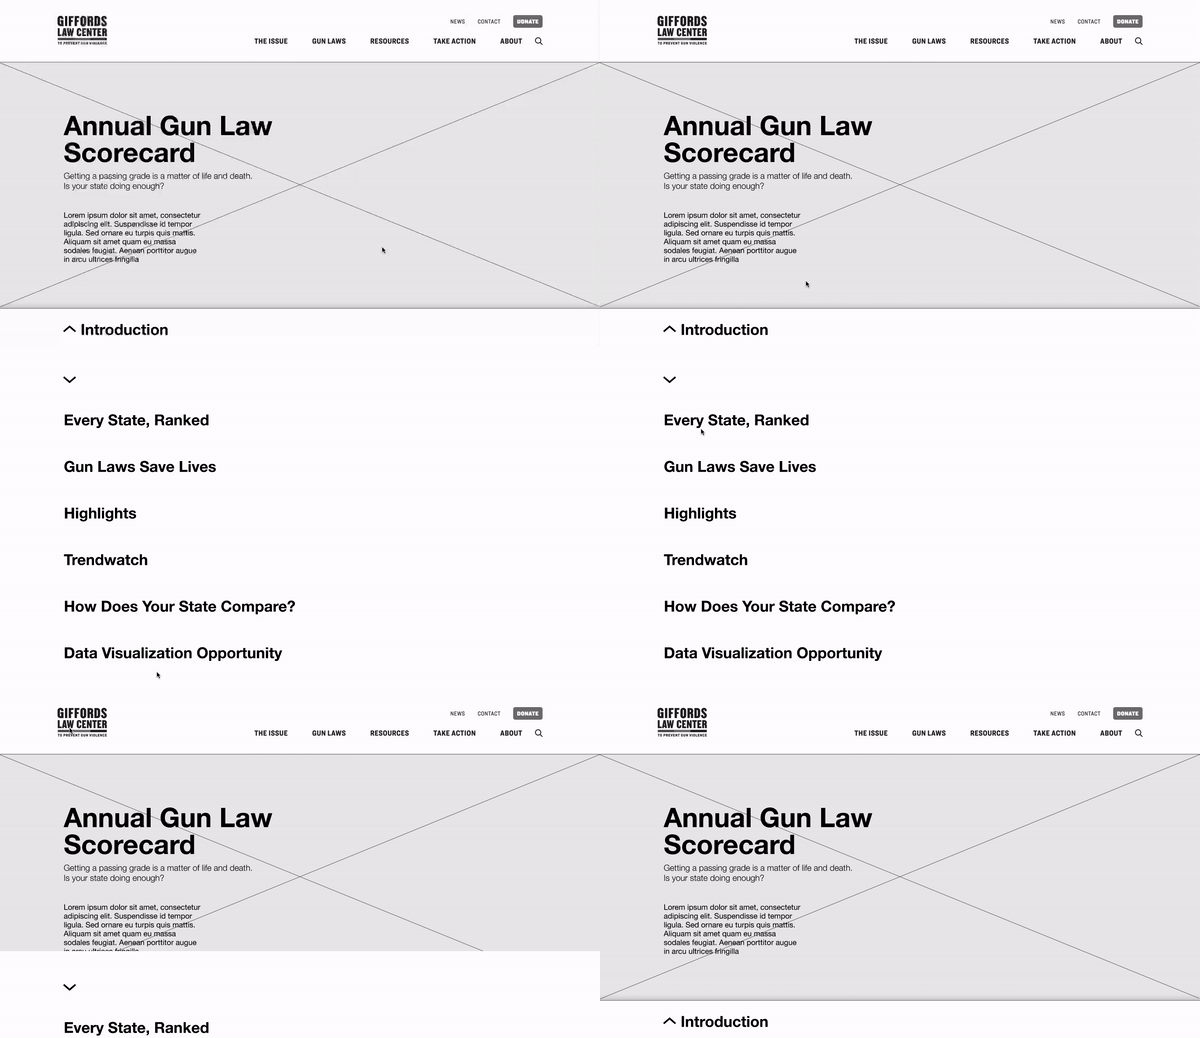
It was either this or break up the experience into several pages.
Final thoughts
This project was a blast—and the fastest turnaround I’d ever faced. To hit the deadline, we worked in true sprint mode, collaborating constantly and cutting anything that slowed us down. There were several occasions where I had an idea for an interaction that could have been a more delightful user experience, but was deprioritized due to time constraints. I’m hopeful that the Giffords team keeps my ideas in their back pocket for another day.